
The Sun Has Won, Part 1: Market Inevitabilities In Electricity Production
Today we publish the first in depth Research Report from Planetary Technologies. Here is the PDF:
“The Sun Has Won, Part 1: Market Inevitabilities In Electricity Production”, by Rob Carlson, Managing Director.
The Sun Has Won, Part 1: Market Inevitabilities In Electricity Production
Rob Carlson, PhD, Managing Director, Planetary Technologies, LLC
Summary: Solar power now provides the lowest cost electricity generation in history. The continuing decrease in solar costs is driven by technological change, economies of scale, and by learning effects derived from the expansion of manufacturing. This cost trend is coupled to an annual exponential increase in solar installation that has run for more than 25 years and that is likely to continue, if not accelerate. Falling costs for solar power are accompanied by a long-term shift in the structure of investment; in 2021 more money was invested on an annual basis into renewables projects than into fossil fuel projects, more new solar power was built than any other generating capacity, and the cost of capital for solar projects was at least 4X lower than for fossil fuel projects. As a result, new solar installation now constitutes more capital-efficient electricity generation than any other source with the exception of wind, which is economically and physically efficient only when installed at very large scales. Taken together, these factors reveal that solar power is now a better, and lower risk, investment than new fossil-fueled electricity projects. Despite this cost advantage, many countries will continue to build and operate coal and gas generating capacity because 1) these facilities provide both electricity generation and employment, and 2) constructing adequate manufacturing capacity for renewables to fully replace fossil fuels is likely the work of decades. Yet by approximately 2025, operating the vast majority of existing fossil fuel power production will be inefficient and uncompetitive when compared to the combination of new solar power and battery storage. To the extent that local energy costs for manufacturing and services determine global competitiveness—particularly in any manufacturing process that uses, or can be adapted to use, electricity—the cost advantage brought by deploying low-cost solar will drive adoption in regions that wish to succeed economically. The economic and financial advantages of solar relative to fossil fuels suggest that the next thirty years will see solar power come to dominate global electricity production.
Whereas the marginal cost of electricity production by PV and wind is approximately zero, to produce ongoing value at fossil-fueled electricity plants requires the constant incineration of capital.
Excerpts:
The sun has won
The fundamental advantage of solar power over fossil fuels is that, for the same total investment, solar produces more useful energy than does combusting fossil fuels. That is, solar power is more capital-efficient than fossil fuels. Therefore, continued spending on fossil fuels is spending on economically uncompetitive electricity production. To be sure, there remains money to be made from fossil fuels in the short term because most electricity production capacity extant today requires combustion; it will be the work of decades to replace it. Nevertheless, over the long term, public or private organizations that continue to invest in fossil fuels will be building structurally inefficient infrastructure, with attendant higher operating costs, that will hinder economic performance.
How should we measure the financial advantage of solar over fossil fuels, and with which units? Capital efficiency is typically defined to be a ratio that describes return on investment or on operational spending, where the specific numerator and denominator might be an absolute amount of investment or a rate of investment chosen to suit a particular narrative of financial performance. Here I define Capital Efficiency as energy produced per dollar invested over the lifetime of a power plant, in units of MegaWatt*hours per dollar (MWh/$), which is the inverse of the unsubsidized Levelized Cost of Energy (LCOE) for utility scale generation (Figure 1).
The LCOE (inset, Figure 1) takes into account all contributions to lifetime cost, including maintenance and finance, and is therefore a means to compare disparate energy production technologies. The LCOE of solar has fallen steeply over the last 15 years. However, pandemic-related supply chain issues have affected solar power hardware costs in the same way as costs in other sectors. The prices for solar module components such as silicon, aluminum, and glass have followed the price of energy where it is set by the cost of fossil fuels, which rose through the 12 months prior to the publication of this document, and which increases will undoubtedly show up in future LCOE data sets. Further price impacts may be felt from the outbreak of hostilities in Europe and subsequent sanctions.

Figure 1. The Capital Efficiency for utility scale generation, here defined as the inverse of the Levelized Cost of Energy (LCOE) (Inset: Lazard's mean LCOE). The LCOE takes into account all contributions to lifetime cost and is therefore a means to compare disparate energy production technologies (Source: Lazard, Planetary Technologies).
Yet the cost of electricity from already-operating solar has not been affected by fossil fuel price fluctuations because the cost of sunlight does not depend on the price of coal or gas, nor upon any state of war. Prices for renewable energy are quite stable over time, and the use of that energy for commercial operations comes at a lower cost and carries a lower risk than reliance on fossil fuels, which fluctuate in price and availability. This fact points to an inevitable future. As photovoltaic modules, and all their constituent components, are increasingly manufactured using electricity produced by photovoltaic module installations, the cost of new modules will become decoupled from the price of fossil fuels and will fall even further. The implication of the long term cost trend is very clear; solar power is the future of electricity generation.
The economic reality that solar power is less expensive than fossil fuels creates certain market inevitabilities:
Most obviously, the cost advantage of solar power will accelerate the installation of photovoltaic (PV) electricity generation around the globe. This expansion will proceed even without significant improvements in PV efficiency due to extant cost advantages, and the resulting increase in PV manufacturing will by itself continue to expand these cost advantages modestly due to improved economies of scale and learning effects.
Because renewables in general, and PV in particular, are more capital-efficient than fossil-fueled electricity generation, investment will increasingly shift from fossil fuel projects to renewables. To sharpen that conclusion: money that is now spent on fossil fuels will instead be spent on renewables. Headlines and commentaries that fret about the costs of the electrification transition fail to recognize that investment in renewables represents not additional spending, but rather displacement of spending on fossil fuels. Because renewables are more Capital Efficient than fossil fuels, this shift will free up significant capital that may be invested in more lucrative and beneficial projects.
A corollary of the cost and competitive advantage of renewables is that energy and climate scenarios that posit any significant coal or gas combustion in 2050 are assuming highly irrational economic behavior occurring not just once, but persisting over the next three decades. Such scenarios are likely of limited utility as planning tools for guiding policy and investment.
Finally, now that PV has crossed below the cost threshold at which fossil fuels operate, PV will begin competing with itself and other low-cost renewables (e.g., wind) rather than with fossil fuels. Given that solar is already improving exponentially, competition will spark an intense demand for technical improvements that reduce the installed cost per watt. Schumpeter's gale will blow through the solar industry just as it is doing in the rest of the energy industry.
…
Distributed solar contributes to grid stability
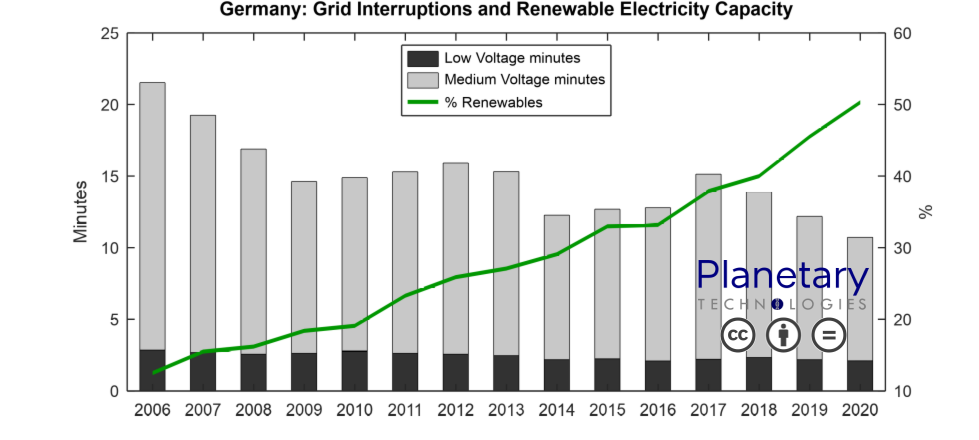
Figure 2. German national grid interruptions since 2006 and share Renewable Electricity Production (Source: German Federal Network Agency and Fraunhofer ISE).
Renewable energy skeptics frequently argue that an increasing reliance on variable wind and solar generation will necessarily result in grid instability. In reality, the German electricity grid became more stable between 2006 and 2020 while the share of renewable electricity generation grew from 6% to 50% (Figure 2). Over that same period, the absolute amount of electricity generated from nuclear and fossil-fueled power fell by 50% and 60%, respectively. The anti-correlation of renewable capacity and grid instability across an economy and a grid the size of Germany's stands as sufficient to refute the stability skeptics. Yet the case is stronger; the increase in grid stability has been causatively attributed to 1) the vast majority of PV installations in Germany being at the community scale or smaller, and 2) those distributed installations accounting for more than half the total PV generating capacity in the country. At a minimum, one can conclude that renewable capacity of at least 50% is compatible with increasing grid stability, even before widespread battery deployment, if system administrators choose to pursue these combined goals. There is no reason to expect this result to be localized to Germany. Consequently, given the combined economic benefits of lower electricity prices and fewer interruptions, grid stability concerns around the world may accelerate rather than retard PV adoption. The grid stability benefits of distributed generation may become recognized as a means to reduce spending on infrastructure maintenance and upgrades, an advantage that improves the value proposition of rooftop and community solar.
…
Sunfight at the PV Corral
The future course of PV installation around the world is best understood through evaluating the recent past, and in particular the impact of the rapid decrease in PV costs on the displacement of fossil fuels. There are three distinct relative price Eras to consider, as illustrated in Figure 3.

Figure 3. At the top, a sketch illustrating the relative number of new PV installations and fossil fuel projects as the relative Capital Efficiency has shifted since 2009. In Era 1, PV installations were driven primarily by policy. In Era 2, PV installations were driven by a mix of policy and price. In Era 3, new PV is less expensive than operating fossil fuel plants and installation is driven by price. Bottom: Capital Efficiency (1/LCOE), repeated from Figure 1.
In Era 1, the vast majority of PV installations produced less electricity per dollar than those burning coal. The global weighted average Capital Efficiency for utility scale PV reached approximate parity with coal for the first time only in 2013, and with gas for the first time in 2016. During Era 1, large scale PV installations were driven by subsidies or other policy measures. In Era 2, the “approximate parity” time period, from 2013 up through approximately 2016, it could still be argued that a rational economic actor evaluating new electricity production could choose fossil fuel combustion based on Capital Efficiency. However, from 2016 onwards it has become increasingly difficult for a rational economic actor to decide in favor of fossil fuels over renewables. In Era 3, new renewables are clearly more Capital Efficient than fossil fuel combustion. Given the economic and financial trends described throughout this report, it is apparent that most energy project developers, and their financiers, are now behaving rationally and deciding to install renewables, primarily PV. The incentives in Era 3 are the converse of those in Era 1; going forward, any new fossil fuel combustion capacity installed will be driven by subsidies and policy measures, and will arguably reduce economic competitiveness. The continued roll-out of electricity storage globally will further accentuate the economic advantage of renewable electricity by enabling time-shifting of supply and thereby enabling elimination of expensive fossil fuel peaking capacity. In geographies in which installing new wind and PV today costs less than the marginal cost of coal and gas as fuel, continuing to operate the existing combustion fleet already impairs economic competitiveness.
…
Conclusion
What, then, is the plausible future of solar power? Part 1 of this series has explored the economic and financial constraints on solar power installation over the coming decades. We are now in an era in which every dollar spent on new PV displaces higher cost fossil-fueled electricity production. From this vantage point, it appears likely that there will be as much capital available as can be utilized to build and deploy new renewables around the globe. The practical constraints on the amount of new PV that capital can buy and install include 1) the availability of new solar modules, that is, the combination of the availability of raw materials and of module manufacturing capacity, 2) the availability of installation hardware such as mounting systems, and 3) other factors such as land acquisition, regulation and permitting, and grid connections.
At a more abstract level, there may be a concern among some analysts and commentators that growth rates greater than 20% cannot be maintained simply because it is difficult to imagine that a large quantity can continue to rapidly grow. What are the appropriate considerations for determining the short-term and long-term trajectories for installation? The growth of global IT infrastructure and computational resources, and in particular data centers, serve as an example of a capital- and energy-intensive industry that has been accelerating for decades. Part 2 of this series will focus on a quantitative exploration of reasonable limits for total PV installation at a global scale and how quickly we might bump up against those limits.
For additional insight into the future of electricity production markets, please see the full report, “The Sun Has Won, Part 1: Market Inevitabilities In Electricity Production”.

Creative Commons image licence (Attribution-NoDerivatives 4.0 International (CC BY-ND 4.0)) terms:
Share — copy and redistribute the material in any medium or format for any purpose, even commercially.
Attribution — You must give appropriate credit, provide a link to the license, and indicate if changes were made. You may do so in any reasonable manner, but not in any way that suggests the licensor endorses you or your use.
NoDerivatives — If you remix, transform, or build upon the material, you may not distribute the modified material.
All other content ©2022 Planetary Technologies.